Running PassMark on Raspberry Pi Zero 2 (BCM2710A1/RP3A0)
Running PassMark PerformanceTest on a Raspberry Pi Zero 2 W, from finding an aarch64 build and fixing missing ncurses libraries to why the OOM killer stops a full benchmark run from ever finishing.
18.9.2026
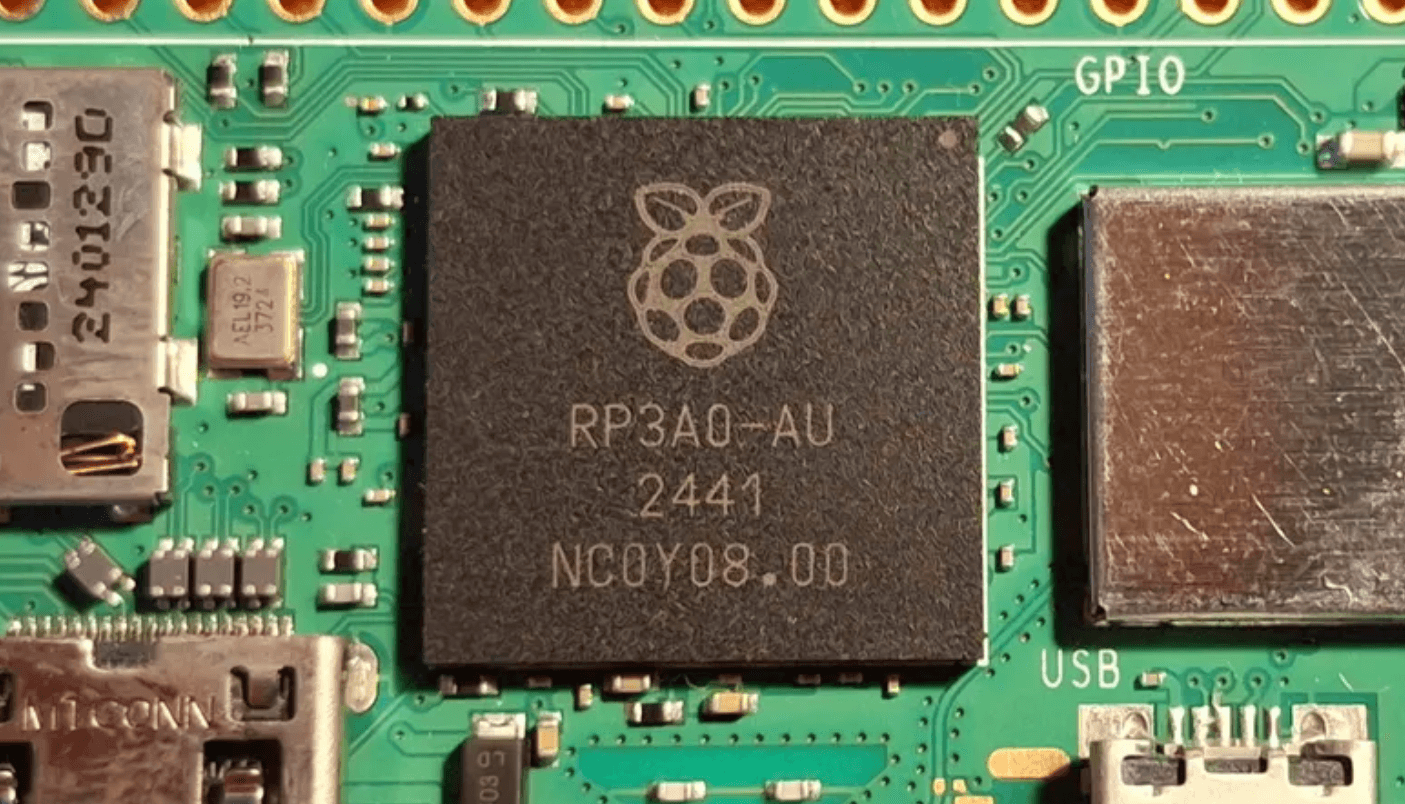
Close-up of the RP3A0 SoC on the Raspberry Pi Zero 2 W.
TL;DR: the PassMark score is 153 but there is a reason why there is no uploaded result, for that you will need to read it in full to understand it.
Device: Raspberry Pi Zero 2 W Rev 1.0
CPU: BCM2710A1 Cortex-A53
OS: Debian 13 ARM64
PassMark PerformanceTest Linux 11.0.1004
PassMark download
to download PassMark I went to passmark download page. To find out the target architecture i have and which binary I needed to install, I ran:
$ uname -a
Linux raspberry 6.12.47+rpt-rpi-v8 #1 SMP PREEMPT Debian 1:6.12.47-1+rpt1 (2025-09-16) aarch64 GNU/Linux
Which showed I have aarch64 and because of that I have downloaded the arm64 version via wget:
wget https://www.passmark.com/downloads/PerformanceTest_Linux_ARM64.zipThen I unzipped the file and went to the directory:
7z x PerformanceTest_Linux_ARM64.zip
cd PerformanceTest/
But after running the only binary that was in the folder i got an error:
./PerformanceTest_Linux_ARM64: error while loading shared libraries: libncurses.so.5: cannot open shared object file: No such file or directoryI was missing a library. Debian 13 removed both libncurses5 and libtinfo5 from the normal repositories, so I had to install both packages from Debian 12 (Bookworm).
wget http://deb.debian.org/debian/pool/main/n/ncurses/libtinfo5_6.4-4_arm64.deb
wget http://deb.debian.org/debian/pool/main/n/ncurses/libncurses5_6.4-4_arm64.deb

sudo apt install ./libtinfo5_6.4-4_arm64.deb ./libncurses5_6.4-4_arm64.deb
After the install of the missing packages I was able to run the binary without any errors.
raspberry@raspberry:~/PerformanceTest $ ./PerformanceTest_Linux_ARM64 -help
 pt_linux_arm64 [OPTIONS]

 OPTIONS:
  -debug                      enable debug logging
  -p, -P num                  set the num of test processes (between 1 to 1024)
  -d, -D enum                 set the test duration length, enum values are:
                              1 - Short
                              2 - Medium
                              3 - Long
                              4 - Very Long
  -i, -I num                  set the num of test iterations (between 1 to 100)
  -r, -R enum                 enable autorun, enum values are:
                              1 - CPU Suite only
                              2 - Memory Suite only
                              3 - All Suites
  -h, -H, -help              display help message
Before running the benchmark
Before running the benchmark I was stunned by the high memory usage of the Pi. There were a lot of services which were using a lot of memory and which shouldn’t be running.
raspberry@raspberry:~ $ ps aux --sort=-rss | head -20
USER         PID %CPU %MEM    VSZ   RSS TTY      STAT START   TIME COMMAND
raspber+    1112  0.9  3.4 774628 14652 ?        Sl   17:52   0:04 /usr/bin/wf-panel-pi
root           1  0.9  1.5  25104  6500 ?        Ss   17:51   0:05 /sbin/init splash
root         673  0.3  1.2 341980  5432 ?        Ssl  17:51   0:02 /usr/sbin/NetworkManager --no-daemon
raspber+    2122  233  0.8   9104  3812 pts/0    R+   18:00   0:00 ps aux --sort=-rss
raspber+    1918  0.1  0.8   6120  3764 pts/0    Ss   17:52   0:00 -bash
root         294  0.1  0.7  28884  3100 ?        Ss   17:51   0:00 /usr/lib/systemd/systemd-journald
raspber+    1115  1.5  0.6 582616  2768 ?        Sl   17:52   0:07 pcmanfm --desktop
message+     594  0.3  0.6   9596  2564 ?        Ss   17:51   0:01 /usr/bin/dbus-daemon --system --address=systemd: --nofork --nopidfile --systemd-activation --syslog-only
root         604  0.0  0.5  18860  2416 ?        Ss   17:51   0:00 /usr/lib/systemd/systemd-logind
systemd+     340  0.0  0.5  92228  2184 ?        Ssl  17:51   0:00 /usr/lib/systemd/systemd-timesyncd
polkitd      599  0.1  0.4 383076  1884 ?        Ssl  17:51   0:00 /usr/lib/polkit-1/polkitd --no-debug --log-level=notice
raspber+    1888  0.4  0.4 765392  1836 ?        Ssl  17:52   0:02 /usr/bin/wireplumber
raspber+    2123  0.0  0.4   5300  1784 pts/0    S+   18:00   0:00 head -20
root         674  0.0  0.4  18408  1740 ?        Ss   17:51   0:00 /usr/sbin/wpa_supplicant -u -s -O DIR=/run/wpa_supplicant GROUP=netdev
avahi        591  0.2  0.3   5832  1560 ?        Ss   17:51   0:01 avahi-daemon: running [raspberry.local]
raspber+    1642  0.1  0.3 413960  1448 ?        Ssl  17:52   0:00 /usr/libexec/xdg-desktop-portal-gtk
root         589  0.0  0.3 310108  1392 ?        Ssl  17:51   0:00 /usr/libexec/accounts-daemon
root         350  0.1  0.3  35692  1364 ?        Ss   17:51   0:00 /usr/lib/systemd/systemd-udevd
raspber+     886  0.2  0.3 140808  1324 ?        Ssl  17:52   0:01 /usr/bin/labwc -m
Processes like this showed that this is not running in headless mode and that a desktop is running. I was pretty sure I didn’t set it up with a desktop but here it is…
/usr/bin/wf-panel-pi
pcmanfm --desktop
/usr/bin/labwc
xdg-desktop-portal-gtk
To be sure I ran
raspberry@raspberry:~ $ systemctl get-default
graphical.target
which confirmed that it’s running with a graphical env. This is how I set it to not run it again and then i have rebooted.
sudo systemctl set-default multi-user.target
Removed '/etc/systemd/system/default.target'.
Created symlink '/etc/systemd/system/default.target' → '/usr/lib/systemd/system/multi-user.target'.
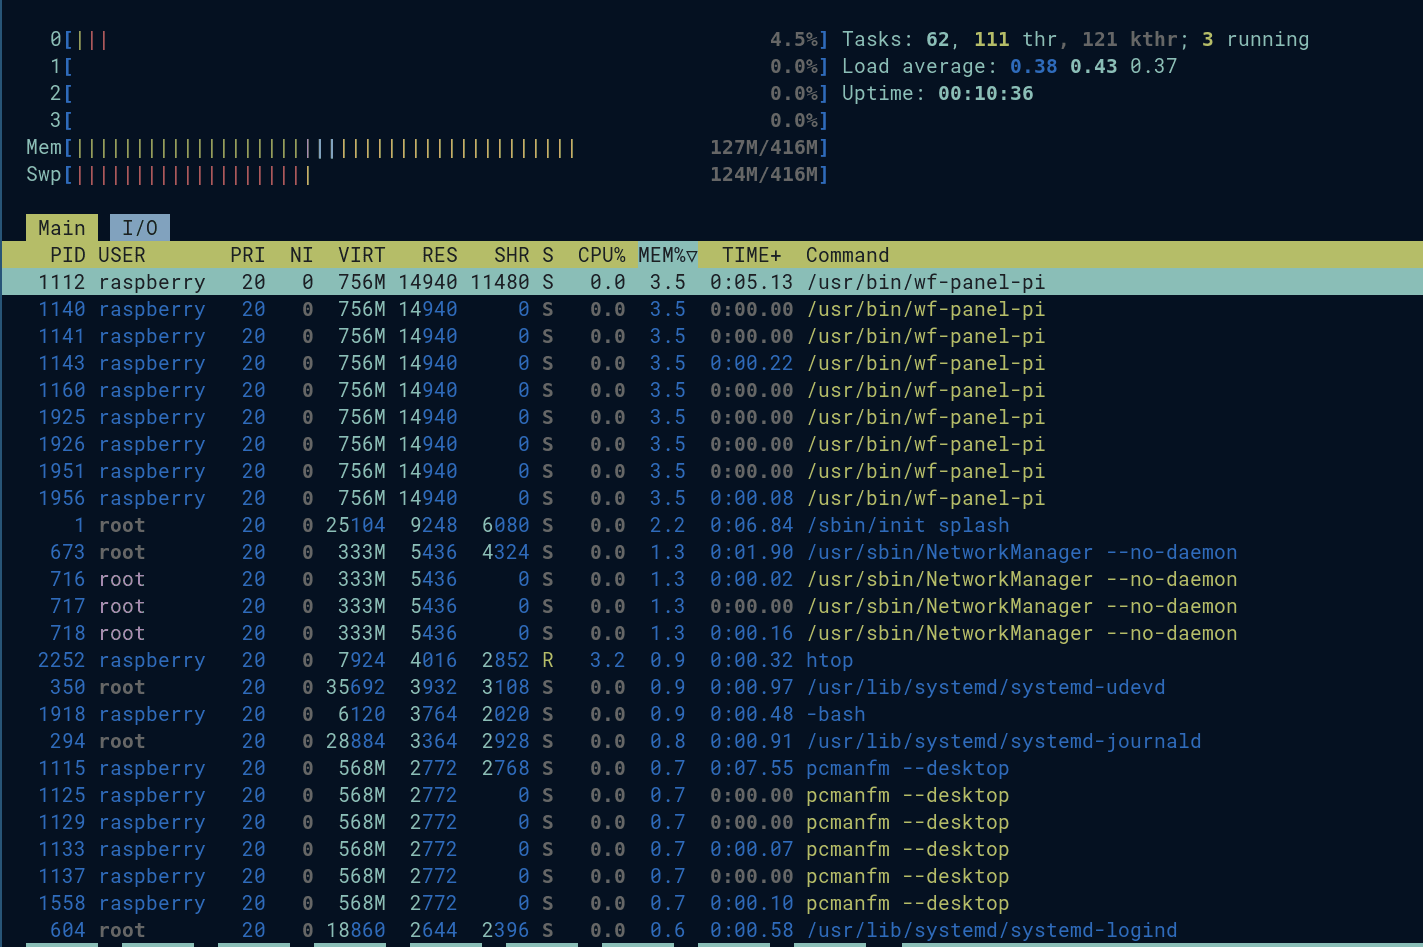
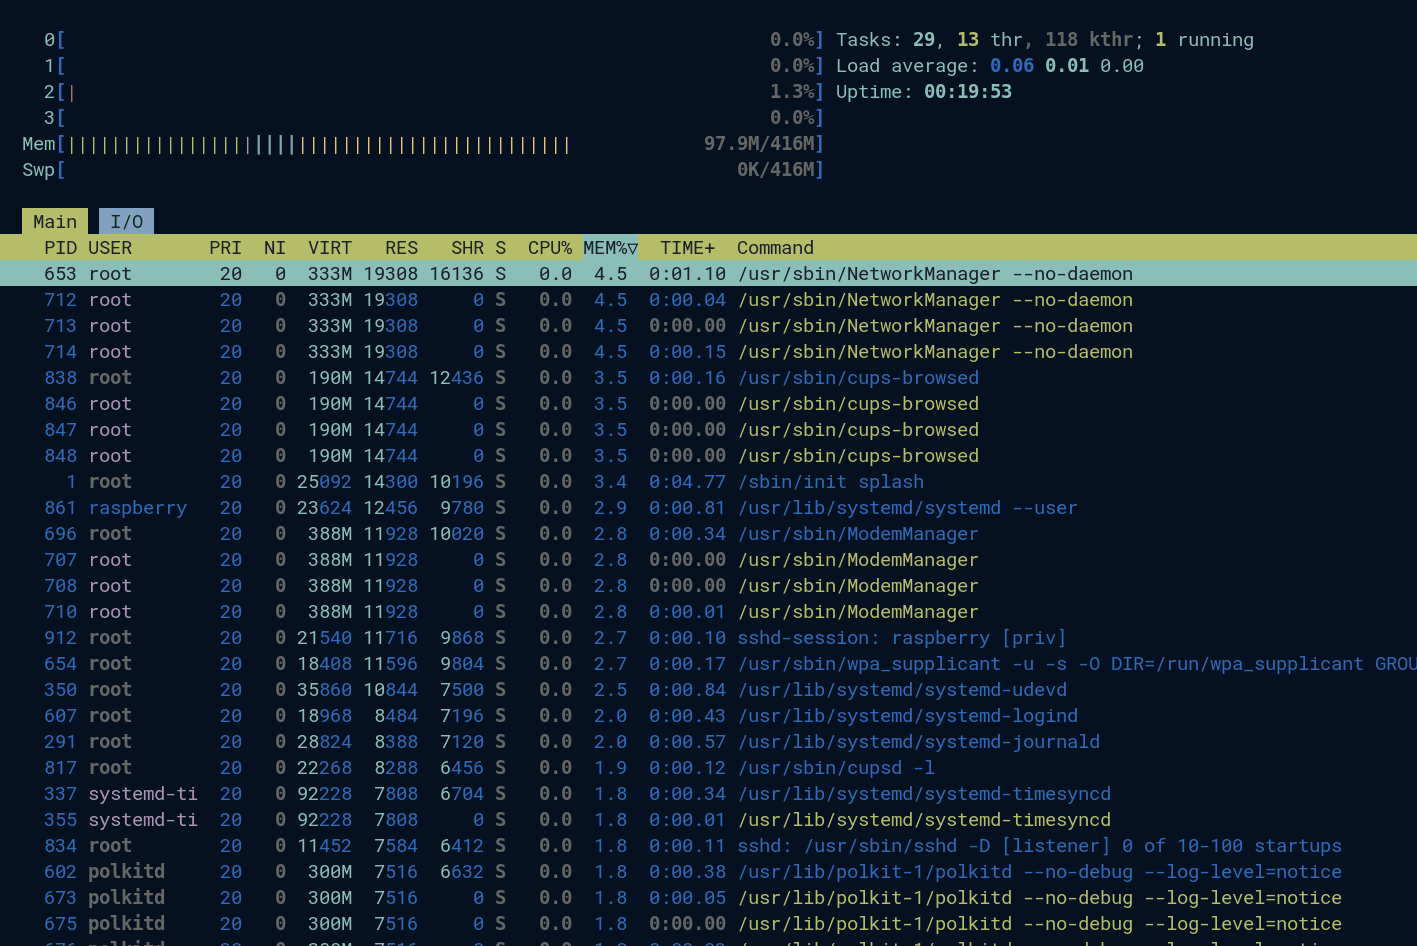
Both of the pictures were taken on a fresh reboot. This is the difference, from total 280Mb to only 97Mb. Yes half of the RAM was in swap but this is still a big difference, especially since the Pi has only 512MB of it.
Running the benchmark
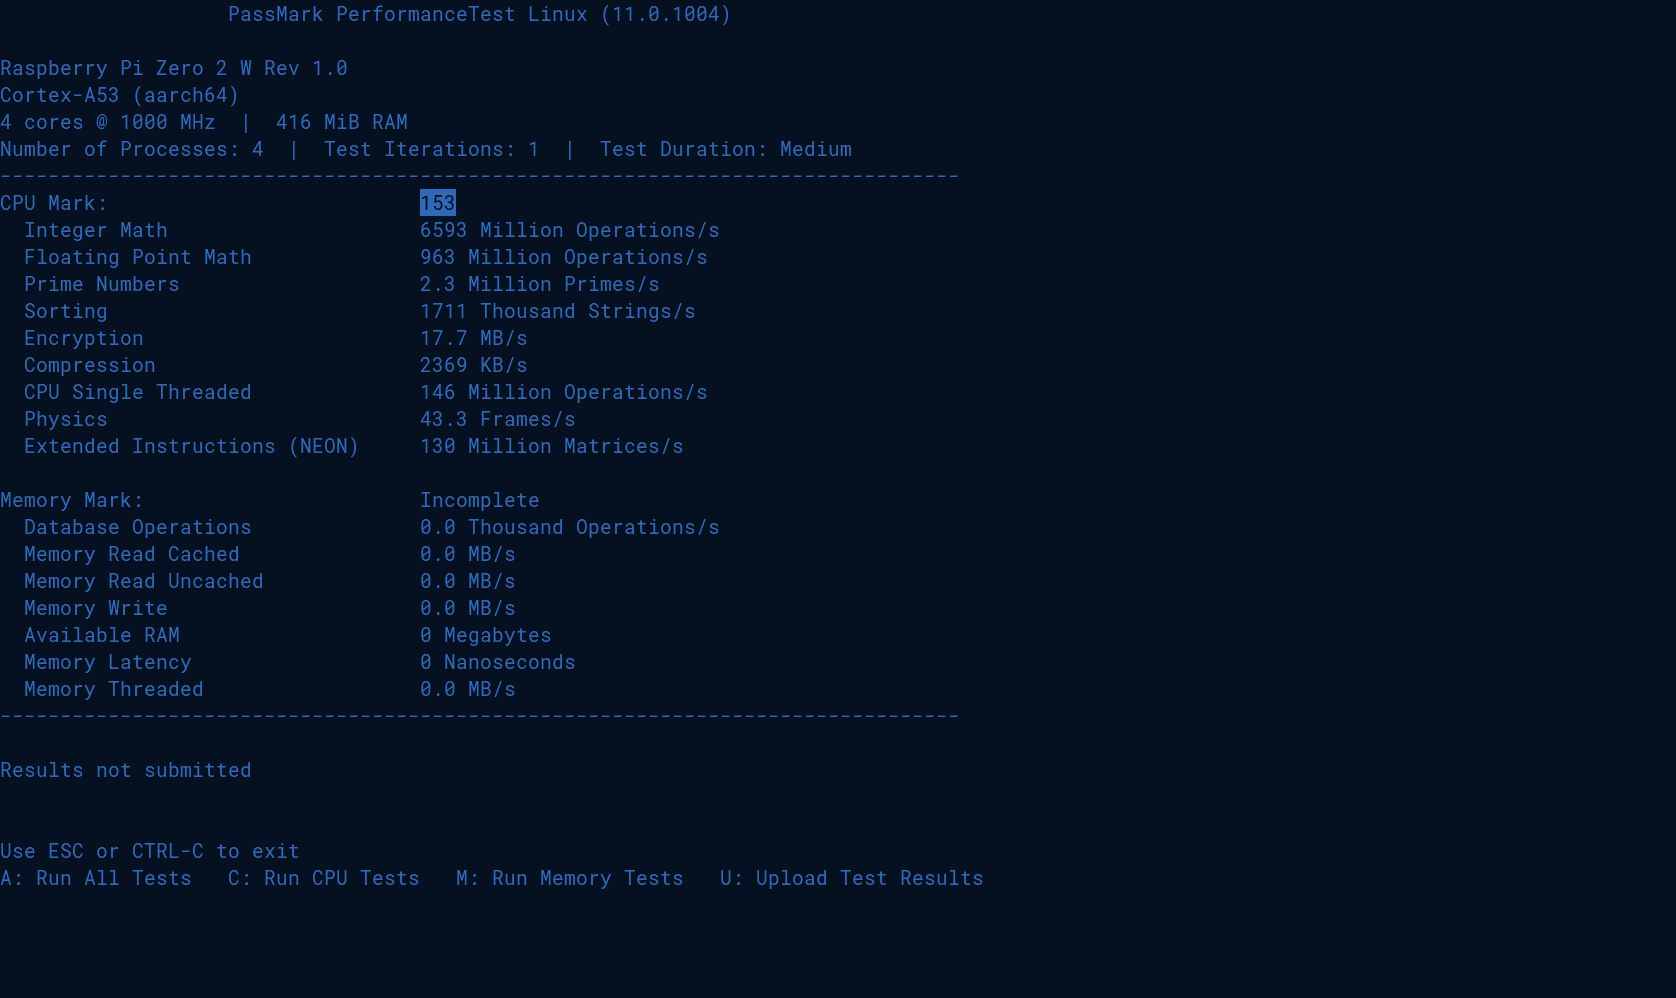
./PerformanceTest_Linux_ARM64then I ran the binary without any arguments and pressed ‘C’ to run the CPU Tests, this is how it ended
CPU Mark: 153The CPU Mark was 153
Why are there no public PassMark results?
To be able to publish the result it requires running the full benchmark, which also includes the full RAM benchmark. It will get stuck on the Database operations.
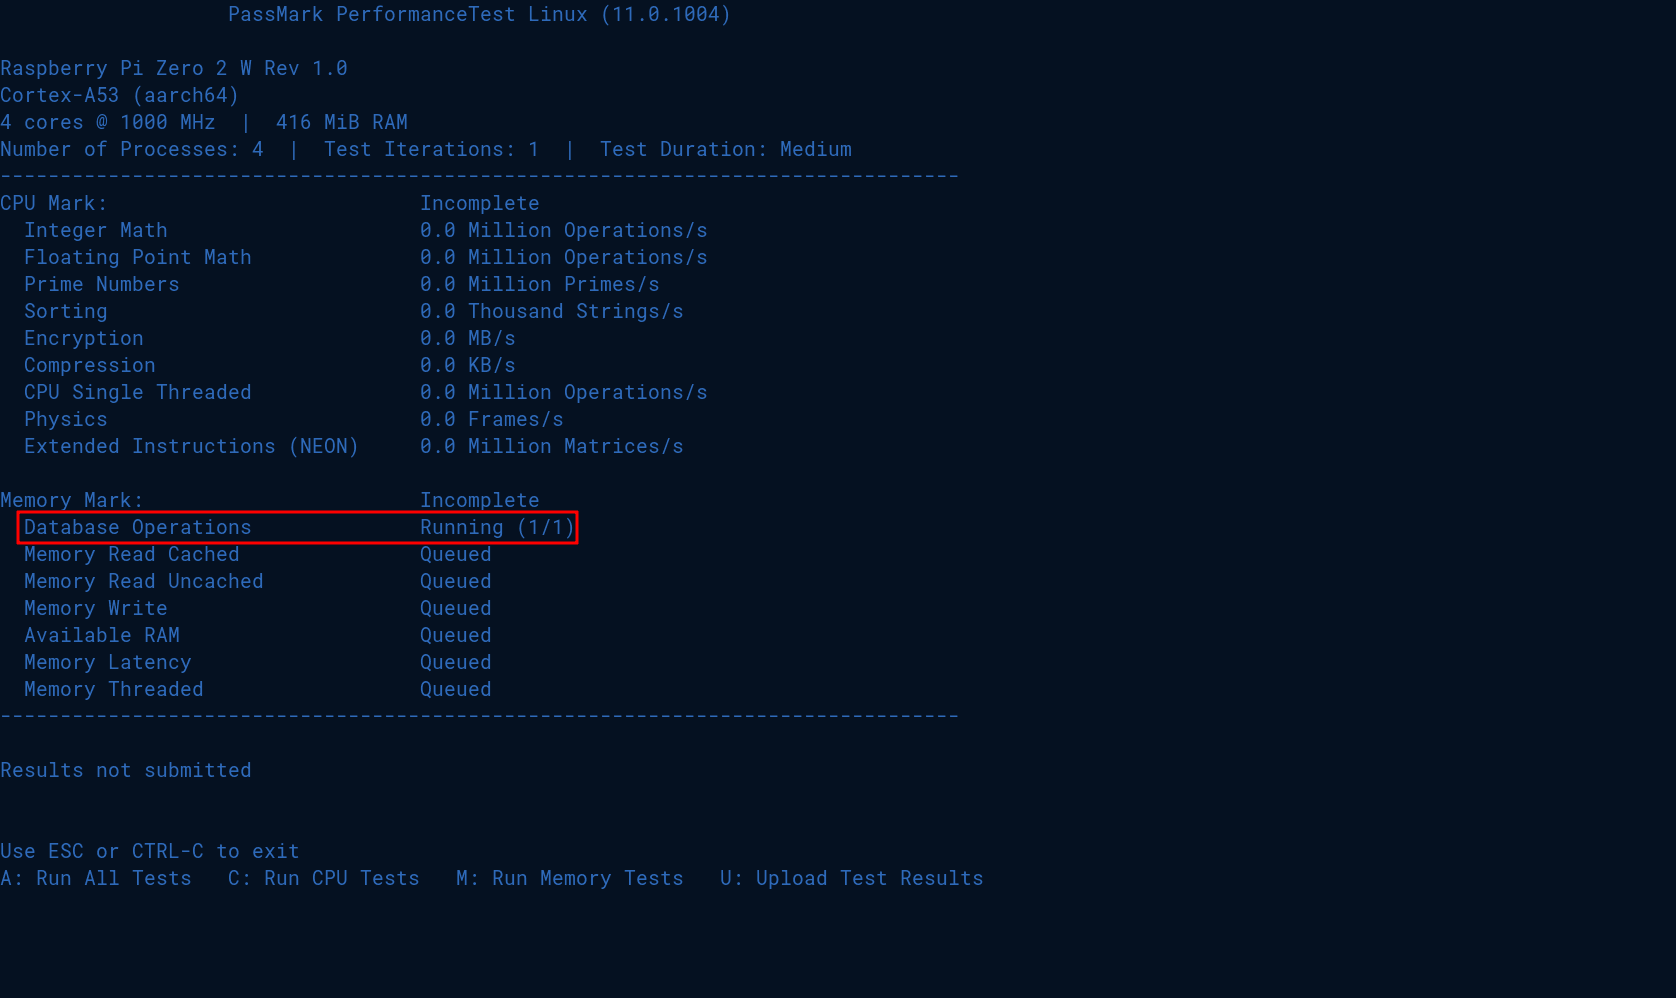
The PerformanceTest always got stuck in the RAM phase, sooner or later the process got zombied and the main PerformanceTest process got stuck.
raspber+    1464  7.0  0.0      0     0 pts/0    Z+   22:26   0:07 [PerformanceTest] <defunct>
raspber+    1465  8.8  0.0      0     0 pts/0    Z+   22:26   0:09 [PerformanceTest] <defunct>
raspber+    1466  7.8  0.0      0     0 pts/0    Z+   22:26   0:08 [PerformanceTest] <defunct>
raspber+    1467  7.8  0.0      0     0 pts/0    Z+   22:26   0:08 [PerformanceTest] <defunct>
Running dmesg showed every time that the OOM (out of memory) killer killed the process and never let the benchmark finish. Even using -p 1 -i 1 it never worked, it always got OOM.
$ sudo dmesg -w
[  789.387613] Node 0 DMA free:114876kB boost:16384kB min:32768kB low:36864kB high:40960kB reserved_highatomic:4096KB active_anon:68524kB inactive_anon:148852kB active_file:1732kB inactive_file:27636kB unevictable:0kB writepending:0kB present:458752kB managed:426136kB mlocked:0kB bounce:0kB free_pcp:0kB local_pcp:0kB free_cma:80576kB
[  789.387641] lowmem_reserve[]: 0 0 0 0
[  789.387664] Node 0 DMA: 5196*4kB (UMEHC) 2697*8kB (UMEHC) 1358*16kB (UMEHC) 671*32kB (UMEHC) 215*64kB (UMEHC) 62*128kB (UMEHC) 8*256kB (UMEC) 10*512kB (UMH) 1*1024kB (H) 0*2048kB 0*4096kB = 115448kB
[  789.387763] 7556 total pagecache pages
[  789.387768] 0 pages in swap cache
[  789.387773] Free swap  = 421116kB
[  789.387779] Total swap = 425980kB
[  789.387784] 114688 pages RAM
[  789.387789] 0 pages HighMem/MovableOnly
[  789.387794] 8154 pages reserved
[  789.387799] 65536 pages cma reserved
[  789.387804] Tasks state (memory values in pages):
[  789.387808] [  pid  ]   uid  tgid total_vm      rss rss_anon rss_file rss_shmem pgtables_bytes swapents oom_score_adj name
[  789.387855] [    291]     0   291     7206     1611      256     1260        95    73728        0          -250 systemd-journal
[  789.387871] [    338]   991   338    23057     1622      256     1366         0    77824        0             0 systemd-timesyn
[  789.387888] [    348]     0   348     8923     2260      768     1492         0    86016        0         -1000 systemd-udevd
[  789.387911] [    501]   102   501     1710      507       96      411         0    49152        0             0 rpcbind
[  789.387927] [    520]     0   520     1252      299       32      267         0    40960        0             0 blkmapd
[  789.387943] [    591]   101   591     1458      501       64      437         0    40960        0             0 avahi-daemon
[  789.387958] [    592]     0   592     3217      767      128      639         0    53248        0             0 bluetoothd
[  789.387974] [    593]     0   593     1745      555       32      523         0    40960        0             0 cron
[  789.387989] [    594]   990   594     2210      747      256      491         0    49152        0          -900 dbus-daemon
[  789.388004] [    598]   988   598    76920      937      160      777         0    86016        0             0 polkitd
[  789.388020] [    601]   101   601     1414      320       37      283         0    40960        0             0 avahi-daemon
[  789.388036] [    603]     0   603     4741     1735      288     1447         0    65536        0             0 systemd-logind
[  789.388051] [    659]     0   659    85492     3232      704     2528         0   167936        0             0 NetworkManager
[  789.388066] [    660]     0   660     4602     1425      384     1041         0    73728        0             0 wpa_supplicant
[  789.388082] [    688]     0   688    81103     1656      416     1240         0   131072        0             0 ModemManager
[  789.388097] [    809]     0   809     5567     1419      416     1003         0    73728        0             0 cupsd
[  789.388113] [    822]     0   822     2274      642      128      514         0    49152        0             0 login
[  789.388128] [    826]     0   826     2863     1206      288      918         0    57344        0         -1000 sshd
[  789.388144] [    831]     0   831    48821     2313      512     1801         0   131072        0             0 cups-browsed
[  789.388160] [    855]  1000   855     5717     2351      608     1743         0    77824        0           100 systemd
[  789.388176] [    858]  1000   858     5975      546       70      476         0    73728      352           100 (sd-pam)
[  789.388191] [    878]  1000   878     1786      564       64      500         0    40960        0           200 mpris-proxy
[  789.388207] [    879]  1000   879     2220     1248      544      704         0    40960        0             0 bash
[  789.388223] [    880]  1000   880     1994      605       64      541         0    40960        0           200 dbus-daemon
[  789.388238] [    895]     0   895     5385     1847      448     1399         0    81920        0             0 sshd-session
[  789.388254] [    903]  1000   903     5412     1245      426      819         0    81920        0             0 sshd-session
[  789.388270] [    904]  1000   904     2252     1279      576      703         0    45056        0             0 bash
[  789.388290] [    973]  1000   973     8691     2573      416     2157         0    98304        0             0 PerformanceTest
[  789.388315] [    997]  1000   997    52970    45517    44642      875         0   446464       64             0 PerformanceTest
[  789.388330] oom-kill:constraint=CONSTRAINT_NONE,nodemask=(null),cpuset=/,mems_allowed=0,global_oom,task_memcg=/,task=PerformanceTest,pid=997,uid=1000
[  789.388384] Out of memory: Killed process 997 (PerformanceTest) total-vm:211880kB, anon-rss:178568kB, file-rss:3500kB, shmem-rss:0kB, UID:1000 pgtables:436kB oom_score_adj:0
I am not by far some Linux wizard so I don’t know if I am missing or doing something wrong, but taking into account also that there are no public PassMark results available, there might actually be nothing to be done about it.